EXFO Reports Fourth Quarter and Fiscal 2017 Results
EXFO Inc., the network test, monitoring and analytics experts, announced today financial results for the fourth quarter and fiscal year ended August 31, 2017.
QUEBEC CITY, CANADA, October 12, 2017 — EXFO Inc. (NASDAQ: EXFO) (TSX: EXF), the network test, monitoring and analytics experts, announced today financial results for the fourth quarter and fiscal year ended August 31, 2017.
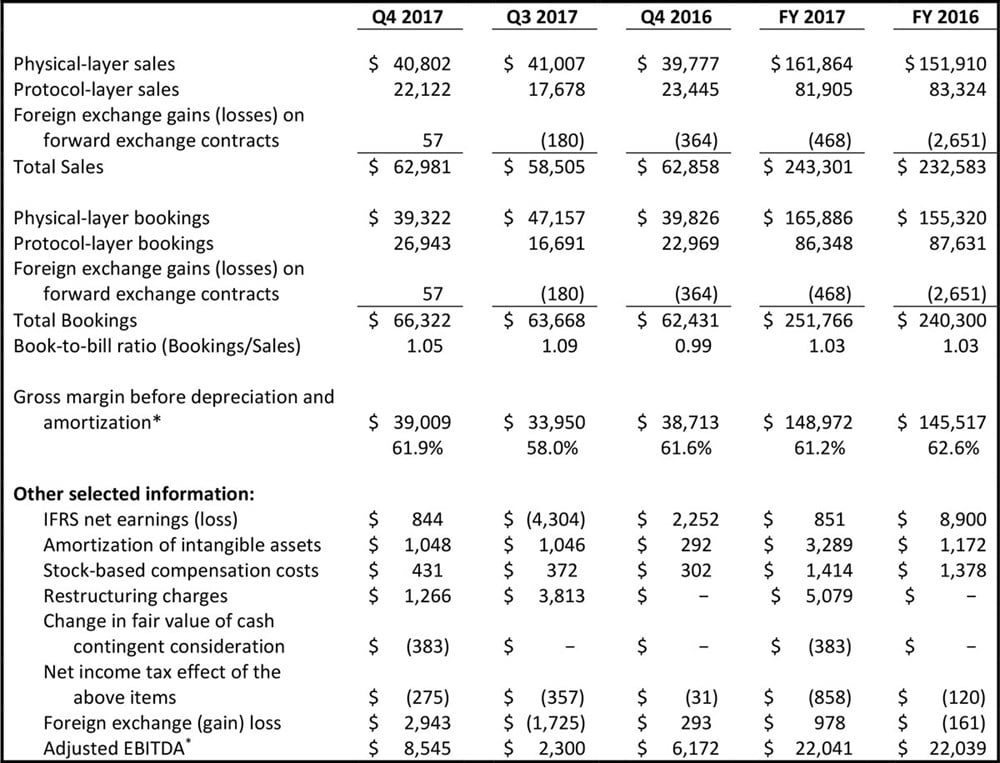
Sales in the fourth quarter of fiscal 2017 reached US$63.0 million compared to US$58.5 million in the third quarter of 2017 and US$62.9 million in the fourth quarter of 2016. Annual sales increased 4.6% to US$243.3 million in fiscal 2017 from US$232.6 million in 2016.
Bookings totaled US$66.3 million for a book-to-bill ratio of 1.05 in the fourth quarter of fiscal 2017 compared to US$63.7 million in the third quarter of 2017 and US$62.4 million in the fourth quarter of 2016. Overall for fiscal 2017, bookings increased 4.8% to US$251.8 million for a book-to-bill ratio of 1.03 from US$240.3 million in 2016.
Gross margin before depreciation and amortization* attained 61.9% of sales in the fourth quarter of fiscal 2017 compared to 58.0% in the third quarter of 2017 and 61.6% in the fourth quarter of 2016. Gross margin included restructuring charges of 0.2% of sales in the fourth quarter of 2017, 2.7% of sales in the third quarter of 2017 and nil in the fourth quarter of 2016. In fiscal 2017, gross margin reached 61.2% of sales compared to 62.6% in 2016. Gross margin included restructuring charges of 0.7% of sales in 2017 and nil in 2016.
In the fourth quarter of fiscal 2017, IFRS net earnings amounted to US$0.8 million, or US$0.02 per diluted share, compared to a net loss of US$4.3 million, or US$0.08 per share, in the third quarter of 2017 and net earnings of US$2.3 million, or US$0.04 per diluted share, in the fourth quarter of 2016. Net earnings in the fourth quarter of 2017 included net expenses totaling US$5.3 million: US$0.9 million in after-tax amortization of intangible assets, US$0.4 million in stock-based compensation costs, US$1.2 million in after-tax restructuring changes, US$0.4 million for the positive change in the fair value of the cash contingent consideration related to the Ontology Systems acquisition, US$0.3 million in after-tax acquisition-related costs, and a foreign exchange loss of US$2.9 million.
In fiscal 2017, IFRS net earnings totaled US$0.9 million, or US$0.02 per diluted share, compared to US$8.9 million, or US$0.16 per diluted share, in 2016. Net earnings in 2017 included net expenses totaling US$10.6 million: US$2.7 million in after-tax amortization of intangible assets, US$1.4 million in stock-based compensation costs, US$4.8 million in after-tax restructuring charges, US$0.4 million for the positive change in the fair value of the cash contingent consideration related to the Ontology Systems acquisition, US$1.1 million in after-tax acquisition-related costs, and a foreign exchange loss of US$1.0 million. Adjusted EBITDA* totaled US$8.5 million, or 13.6% of sales, in the fourth quarter of fiscal 2017 compared to US$2.3 million, or 3.9% of sales, in the third quarter of 2017 and US$6.2 million, or 9.8% of sales, in the fourth quarter of 2016. In fiscal 2017, adjusted EBITDA totaled US$22.0 million compared to US$22.0 million in 2016.
On September 8, 2017, EXFO acquired a 33.1% stake in Astellia, a global leader in the performance analysis of mobile networks and subscriber experience. EXFO intends to purchase publicly traded Astellia’s remaining equity through a public tender offer. On October 2, 2017, EXFO closed the acquisition of Yenista Optics, a supplier of high-end optical test equipment for the laboratory and manufacturing markets.
“I am very pleased with EXFO’s financial results in the fourth quarter of 2017, highlighted by revenue at the top of our guidance range, even stronger bookings and our best adjusted EBITDA margin in recent memory,” said EXFO’s CEO Philippe Morin. “Overall in fiscal 2017, we delivered 5% revenue growth and healthy profitability amid a competitive environment. Equally important, we established a solid foundation for future growth with investments—both internally and through acquisitions—in key technology areas like fiber, the Cloud, network virtualization and 5G. These growth initiatives, combined with heightened sales efficiency and recent restructuring measures, should enhance profitability in 2018.”
Selected Financial Information (unaudited)
(In thousands of US dollars)
Operating Expenses
Selling and administrative expenses totaled US$20.8 million, or 33.1% of sales, in the fourth quarter of fiscal 2017 compared to US$22.6 million, or 38.6% of sales, in the third quarter of 2017 and US$21.6 million, or 34.3% of sales, in the fourth quarter of 2016. In fiscal 2017, selling and administrative expenses amounted to US$86.3 million, or 35.5% of sales, compared to US$82.2 million, or 35.3% of sales, in 2016.
Net R&D expenses amounted to US$11.3 million, or 17.9% of sales, in the fourth quarter of fiscal 2017 compared to US$13.3 million, or 22.7% of sales, in the third quarter of 2017 and US$11.3 million, or 18.0% of sales, in the fourth quarter of 2016. In fiscal 2017, net R&D expenses totaled US$47.2 million, or 19.4% of sales, compared to US$42.7 million, or 18.4% of sales, in 2016.
Fiscal 2017 Highlights
- Sales Total sales increased 4.6% to US$243.3 million in fiscal 2017 mainly due to EXFO’s leadership in optical testing, ongoing 100G investment cycle among communications service providers and the company’s growing business with web-scale operators. Sales of Physical-layer solutions (optical and copper access) increased 6.6% year-over-year, while sales of Protocol-layer solutions (transport, datacom, service assurance, analytics and wireless products) dipped 1.7%.
Annual sales in the Americas as well as Europe, Middle East and Africa (EMEA) increased by 5.6% and 8.6%, respectively, while sales in the Asia-Pacific region dropped 2.9%.
EXFO’s largest customer accounted for 10.1% of sales in fiscal 2017, while the company’s top-three customers represented 18.4%. In comparison, EXFO’s largest customer accounted for 7.1% of sales in 2016, while the company’s top-three customers represented 15.6%. - Profitability. EXFO generated adjusted EBITDA of US$22.0 million, or 9.1% of sales, in fiscal 2017 compared to US$22.0 million, or 9.5% of sales, in 2016. The company also delivered US$12.9 million in cash flows from operating activities in 2017 compared to US$24.4 million in 2016.
- Innovation. EXFO launched 16 new products and/or major enhancements in fiscal 2017, addressing four key technology areas: fiber, Cloud, network virtualization and 5G. New product introductions included a 400 Gbit/s optical transport test solution for the lab and manufacturing markets; an automated inspection probe for testing multi-fiber connectors in data centers and radio access networks; a software-based solution, Universal Virtual Synch, enabling communications service providers to accurately and cost-effectively measure network latency; and optical RF over OBSAI (open base station architecture initiative) link test capabilities to complement optical RF over CPRI (common public radio interface) test technology for centralized radio access networks.
Business Outlook
EXFO forecasts sales between US$60 million and US$65 million for the first quarter of fiscal 2018, while IFRS net results are expected to range between a net loss of US$0.01 per share and net earnings of US$0.03 per share.
IFRS net results include US$0.02 per share in after-tax amortization of intangible assets and stock-based compensation costs.
This guidance was established by management based on existing backlog as of the date of this news release, seasonality, expected bookings for the remaining of the quarter, as well as exchange rates as of the day of this release.
Conference Call and Webcast
EXFO will host a conference call today at 5 p.m. (Eastern time) to review fourth quarter and year-end financial results for fiscal 2017. To listen to the conference call and participate in the question period via telephone, dial 1-323-794-2093. Please take note the following conference ID number will be required: 6482663. EXFO’s Executive Chairman Germain Lamonde, CEO Philippe Morin, and Pierre Plamondon, CPA, Vice-President of Finance and Chief Financial Officer, will participate in the call. An audio replay of the conference call will be available two hours after the event until 8:00 p.m. on October 19, 2017. The replay number is 1-719-457-0820 and the conference ID number is 6482663. The audio Webcast and replay of the conference call will also be available on EXFO’s Website at www.EXFO.com, under the Investors section.
About EXFO
EXFO develops smarter network test, monitoring and analytics solutions for the world’s leading communications service providers, network equipment manufacturers and webscale companies. Since 1985, we’ve worked side by side with our customers in the lab, field, data center, boardroom and beyond to pioneer essential technology and methods for each phase of the network lifecycle. Our portfolio of test orchestration and real-time 3D analytics solutions turn complex into simple and deliver business-critical insights from the network, service and subscriber dimensions. Most importantly, we help our customers flourish in a rapidly transforming industry where “good enough” testing, monitoring and analytics just aren’t good enough anymore—they never were for us, anyway. For more information, visit EXFO.com and follow us on the EXFO Blog.
Forward-Looking Statements
This press release contains forward-looking statements within the meaning of the U.S. Private Securities Litigation Reform Act of 1995, and we intend that such forward-looking statements be subject to the safe harbors created thereby. Forward-looking statements are statements other than historical information or statements of current condition. Words such as may, expect, believe, plan, anticipate, intend, could, estimate, continue, or similar expressions or the negative of such expressions are intended to identify forward-looking statements. In addition, any statement that refers to expectations, projections or other characterizations of future events and circumstances are considered forward-looking statements. They are not guarantees of future performance and involve risks and uncertainties. Actual results may differ materially from those in forward-looking statements due to various factors including, but not limited to, macroeconomic uncertainty as well as capital spending and network deployment levels in the telecommunications industry (including our ability to quickly adapt cost structures with anticipated levels of business and our ability to manage inventory levels with market demand); future economic, competitive, financial and market conditions; consolidation in the global telecommunications test and service assurance industry and increased competition among vendors; our ability to successfully integrate businesses that we acquire; capacity to adapt our future product offering to future technological changes; limited visibility with regards to timing and nature of customer orders; longer sales cycles for complex systems involving customers’ acceptances delaying revenue recognition; fluctuating exchange rates; concentration of sales; timely release and market acceptance of our new products and other upcoming products; our ability to successfully expand international operations; and the retention of key technical and management personnel. Assumptions relating to the foregoing involve judgments and risks, all of which are difficult or impossible to predict and many of which are beyond our control. Other risk factors that may affect our future performance and operations are detailed in our Annual Report, on Form 20-F, and our other filings with the U.S. Securities and Exchange Commission and the Canadian securities commissions. We believe that the expectations reflected in the forward-looking statements are reasonable based on information currently available to us, but we cannot assure that the expectations will prove to have been correct. Accordingly, you should not place undue reliance on these forward-looking statements. These statements speak only as of the date of this document. Unless required by law or applicable regulations, we undertake no obligation to revise or update any of them to reflect events or circumstances that occur after the date of this document.
*Non-IFRS Measures
EXFO provides non-IFRS measures (gross margin before depreciation and amortization and adjusted EBITDA) as supplemental information regarding its operational performance. The company uses these measures for the purpose of evaluating historical and prospective financial performance, as well as its performance relative to competitors. These measures also help the company to plan and forecast future periods as well as to make operational and strategic decisions. EXFO believes that providing this information, in addition to IFRS measures, allows investors to see the company’s results through the eyes of management, and to better understand its historical and future financial performance.
The presentation of this additional information is not prepared in accordance with IFRS. Therefore, the information may not necessarily be comparable to that of other companies and should be considered as a supplement to, not a substitute for, the corresponding measures calculated in accordance with IFRS.
Gross margin before depreciation and amortization represents sales less cost of sales, excluding depreciation and amortization.
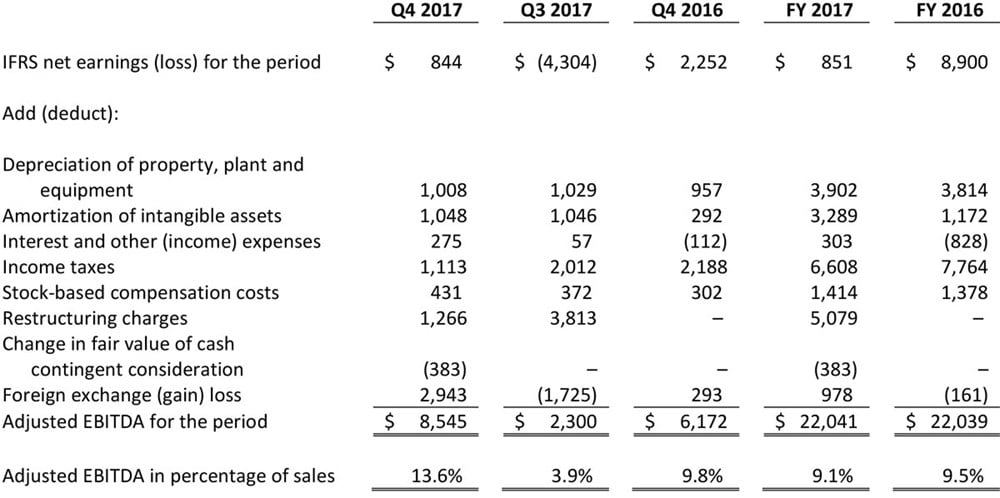
Adjusted EBITDA represents net earnings (loss) before interest, income taxes, depreciation and amortization, stock-based compensation costs, restructuring charges, change in fair value of cash contingent consideration, and foreign exchange gain or loss.
The following table summarizes the reconciliation of adjusted EBITDA to IFRS net earnings (loss) in thousands of US dollars:
Adjusted EBITDA
Click here to download the Consolidated Financial Statements (PDF)