EXFO reports second quarter results for fiscal 2018
- Successfully closes acquisition of publicly traded Astellia
- Sales increase 7.8% to US$64.7 million, including US$1.8 million from Astellia
- Bookings improve 17.3% to US$65.6 million, including US$2.5 million from Astellia
QUEBEC CITY, CANADA, April 10, 2018 — EXFO Inc. (NASDAQ: EXFO, TSX: EXF), the network test, monitoring and analytics experts, reported today financial results for the second quarter and first half ended February 28, 2018.
Following a successful public tender offer, EXFO achieved majority control of Astellia’s share capital on January 26, 2018 and assumed full control of the France-based company on February 28, 2018. Astellia is recognized as a global leader in the performance analysis of mobile networks and subscriber experience.
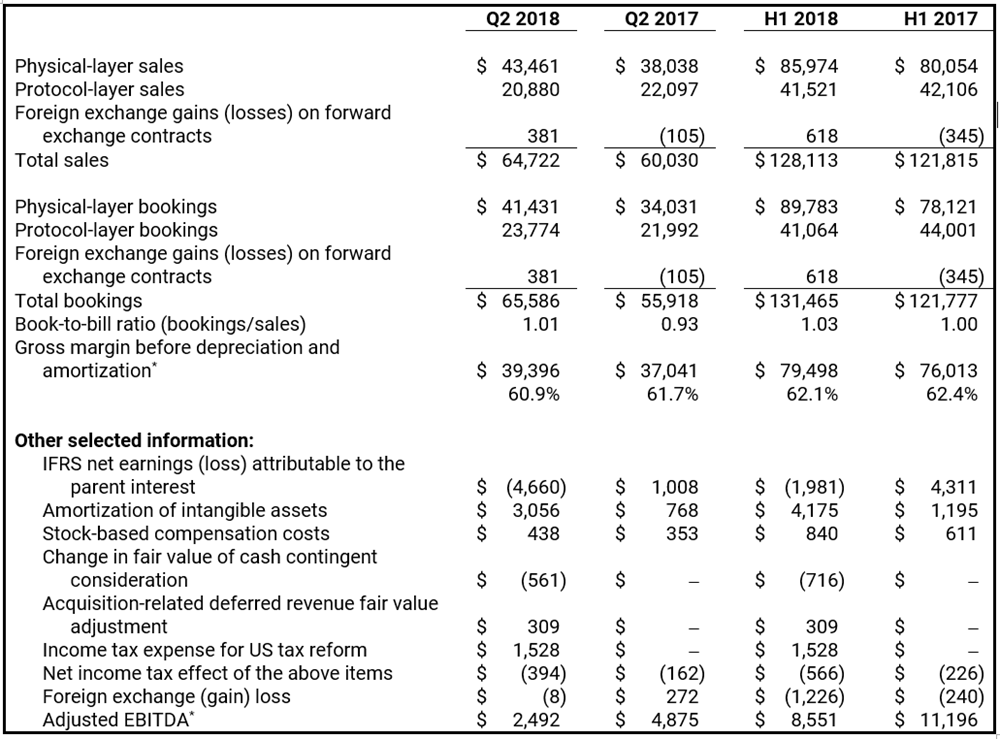
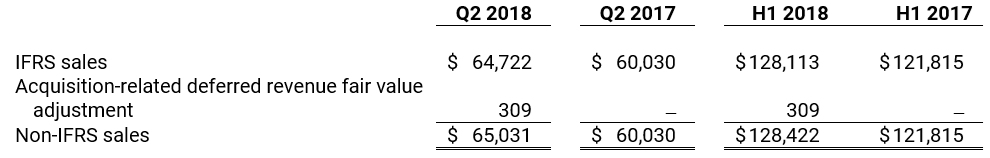
Sales increased 7.8% year-over-year to US$64.7 million in the second quarter of fiscal 2018 and 5.2% to US$128.1 million at the halfway mark of the fiscal year. Sales, excluding the one-month contribution of Astellia, attained US$62.9 million in the second quarter of 2018 compared to US$60.0 million in the second quarter of 2017. Astellia contributed US$1.8 million in sales in the second quarter and first half of 2018. Astellia’s sales were reduced by US$0.3 million to account for acquisition-related fair value adjustment of deferred revenue.
Bookings improved 17.3% year-over-year to US$65.6 million for a book-to-bill ratio of 1.01 in the second quarter of fiscal 2018 and 8.0% to US$131.5 million for a book-to-bill ratio of 1.03 at the halfway mark of the fiscal year. Bookings, excluding the one-month contribution of Astellia, reached US$63.1 million in the second quarter of 2018 compared to US$55.9 million in the same period last year. Astellia contributed US$2.5 million in bookings in the second quarter and first half of 2018.
Gross margin before depreciation and amortization* amounted to 60.9% of sales in the second quarter of fiscal 2018 compared to 61.7% in the second quarter of 2017. Gross margin before depreciation and amortization amounted to 62.1% of sales at the halfway mark of fiscal 2018 compared to 62.4% for the same period in 2017.
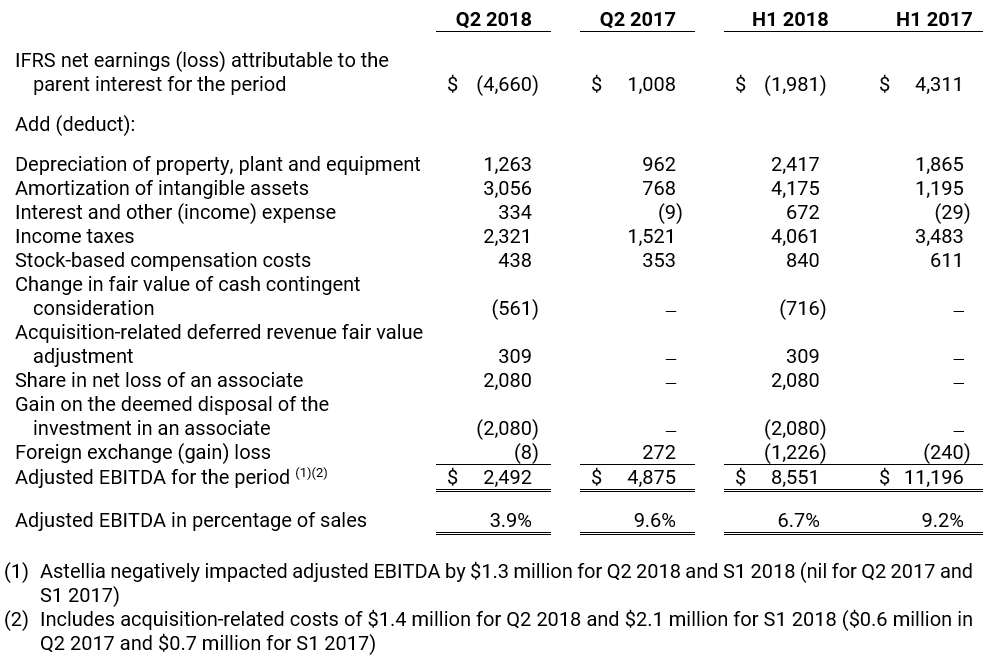
IFRS net loss attributable to the parent interest totaled US$4.7 million, or US$0.08 per share, in the second quarter of fiscal 2018 and US$2.0 million, or US$0.04 per share, at the halfway mark of the fiscal year. In comparison, net earnings attributable to the parent interest totaled US$1.0 million, or US$0.02 per diluted share, in the second quarter of 2017 and US$4.3 million, or US$0.08 per diluted share, in the first half of 2017. EXFO’s share of Astellia’s net loss amounted to US$2.7 million in the second quarter and first half of 2018.
IFRS net loss attributable to the parent interest in the second quarter of 2018 included US$2.7 million in after-tax amortization of intangible assets, US$0.4 million in stock-based compensation costs, US$0.6 million for the positive change in the fair value of the cash contingent consideration related to Ontology Systems, US$1.5 million in after-tax acquisition costs related to Astellia, US$0.3 million for the acquisition-related deferred revenue fair value adjustment, and US$1.5 million in income tax expenses to account for the effects of the recent US tax reform.
IFRS net loss attributable to the parent interest in the first half of 2018 included US$3.6 million in after-tax amortization of intangible assets, US$0.8 million in stock-based compensation costs, US$0.7 million for the positive change in the fair value of the cash contingent consideration related to Ontology Systems, US$2.3 million in after-tax acquisition costs related to Astellia, US$0.3 million for the acquisition-related deferred revenue fair value adjustment, and US$1.5 million in income tax expenses to account for the effects of the recent US tax reform.
Adjusted EBITDA* totaled US$2.5 million, or 3.9% of sales, in the second quarter of 2018 and US$8.6 million, or 6.7% of sales, in the first half of the fiscal year. In comparison, adjusted EBITDA amounted to US$4.9 million, or 8.1% of sales, in the second quarter of 2017 and US$11.2 million, or 9.2% of sales, in the first half of 2017. Astellia negatively affected adjusted EBITDA by US$1.3 million in the second quarter and first half of 2018. In addition, adjusted EBITDA included acquisition-related costs of US$1.4 million in the second quarter of 2018 and US$2.1 million in the first half of the fiscal year.
“I am thrilled with the closing of the Astellia acquisition as it positions EXFO among the top five providers worldwide of sevice assurance solutions,” said Philippe Morin, EXFO’s Chief Executive Officer. “Together, we have created a strong critical mass with solutions deployed at more than 250 network operators, while our global sales organizations have been merged to maximize cross-selling opportunities. Similarly, our unique portfolio of complementary technologies will be combined to deliver unmatched capabilities in high-growth markets like NFV/SDN, IoT and 5G. Although this transformative acquisition involves a short-term financial impact, we expect the additional sales volume, cross-selling opportunities, efficiencies as well as complementary technology and service offerings will contribute to earnings growth in fiscal 2019.”
“In addition, I am pleased with the strong performance from our Physical-layer product line in the second quarter of 2018,” Mr. Morin added. “Despite a seasonally soft reporting period, we delivered robust sales and bookings due to our entrenched leadership position in optical testing and contributions from recent acquisitions.”
Selected Financial Information
(In thousands of US dollars)
Operating Expenses
Selling and administrative expenses totaled US$24.9 million, or 38.5% of sales in the second quarter of fiscal 2017 compared to US$21.3 million, or 35.4% of sales, in the same period last year. At the halfway mark of fiscal 2018, selling and administrative expenses amounted to US$48.1 million, or 37.6% of sales, compared to US$42.9 million, or 35.2% of sales, in the first half of 2017.
Net R&D expenses totaled US$13.1 million, or 20.2% of sales, in the second quarter of fiscal 2018 compared to US$11.3 million, or 18.8% of sales, in the second quarter of 2017. At the halfway mark of fiscal 2018, net R&D expenses amounted to US$24.3 million, or 19.0% of sales, compared to US$22.6 million, or 18.5% of sales, in the first half of 2017.
Second-Quarter Highlights
- Sales increased 7.8% year-over-year due to a solid performance of the Physical-layer product line, revenue contributions from the Astellia, Yenista Optics and Ontology Systems acquisitions, and the positive impact of the decrease in the average value of the US dollar versus other currencies. Physical-layer sales accounted for 68% of total revenue in the second quarter of 2018, while Protocol-layer sales totaled 32%. Revenue distribution among the three main selling regions amounted to 49% in the Americas, 33% in Europe, Middle East and Africa (EMEA) and 18% in Asia-Pacific. EXFO’s top customer accounted for 9.6% of sales, while the top three represented 16.9%.
- Profitability. IFRS net loss attributable to the parent interest totaled US$4.7 million in the second quarter of 2018, while adjusted EBITDA amounted to US$2.5 million. The company also generated US$6.3 million in cash flows from operations in the second quarter.
- EXFO unveiled two key solutions in preparation for Mobile World Congress and Optical Fiber Conference, high-profile industry events held during and after the quarter-end. Major product introductions included SkyRAN, a scalable remote access monitoring solution for fiber-based fronthaul networks. Developed in collaboration with tier-1 mobile network operators, SkyRAN provides real-time, on-demand testing and 24/7 monitoring of optical networks and radio frequency spectrum. EXFO also introduced the CTP10 Component Test Platform with related modules, the fastest test system on the market for measuring insertion loss and return loss on a wide variety of passive optical components, including photonics integrated circuits.
Business Outlook
EXFO forecasts IFRS sales between US$68.0 million and US$73.0 million for the third quarter of fiscal 2018; the company anticipates that IFRS sales will be reduced by US$0.9 million to account for the acquisition-related fair value adjustment of deferred revenue.
IFRS net loss is expected to range between US$0.19 and US$0.15 per share. IFRS net loss includes US$0.09 per share in after-tax amortization of intangible assets and stock-based compensation costs.
This guidance, which is a forward-looking statement, was established by management based on existing backlog as of the date of this news release, seasonality, expected bookings for the remaining of the quarter, Astellia’s preliminary purchase price allocation (PPA) as well as exchange rates as of the day of this news release.
Conference Call and Webcast
EXFO will host a conference call today at 5 p.m. (Eastern time) to review second quarter results for fiscal 2018. To listen to the conference call and participate in the question period via telephone, dial 1-323-794-2551. Please take note the following participant passcode will be required: 9600577. Germain Lamonde, founder and Executive Chairman, Philippe Morin, Chief Executive Officer, and Pierre Plamondon, Vice-President of Finance and Chief Financial Officer, will participate in the call. An audio replay of the conference call will be available two hours after the event until 8:00 p.m. on April 17, 2018. The replay number is 1-719-457-0820 and the required participant passcode is 9600577. The audio Webcast and replay of the conference call will also be available on EXFO’s Website at www.EXFO.com, under the Investors section.
About EXFO
EXFO develops smarter network test, monitoring and analytics solutions for the world’s leading communications service providers, network equipment manufacturers and webscale companies. Since 1985, we’ve worked side by side with our customers in the lab, field, data center, boardroom and beyond to pioneer essential technology and methods for each phase of the network lifecycle. Our portfolio of test orchestration and real-time 3D analytics solutions turns complex into simple and delivers business-critical insights from the network, service and subscriber dimensions. Most importantly, we help our customers flourish in a rapidly transforming industry where “good enough” testing, monitoring and analytics just aren’t good enough anymore—they never were for us, anyway. For more information, visit EXFO.com and follow us on the EXFO Blog.
Forward-Looking Statements
This news release contains forward-looking statements within the meaning of the U.S. Private Securities Litigation Reform Act of 1995, and we intend that such forward-looking statements be subject to the safe harbors created thereby. Forward-looking statements are statements other than historical information or statements of current condition. Words such as may, expect, believe, plan, anticipate, intend, could, estimate, continue, or similar expressions or the negative of such expressions are intended to identify forward-looking statements. In addition, any statements that refer to expectations, projections or other characterizations of future events and circumstances are considered forward-looking statements. They are not guarantees of future performance and involve risks and uncertainties. Actual results may differ materially from those in forward-looking statements due to various factors including, but not limited to, macroeconomic uncertainty as well as capital spending and network deployment levels in the telecommunications industry (including our ability to quickly adapt cost structures to anticipated levels of business and our ability to manage inventory levels with market demand); future economic, competitive, financial and market conditions; consolidation in the global telecommunications test, service assurance and analytics solutions markets and increased competition among vendors; our ability to successfully integrate businesses that we acquire; capacity to adapt our future product offering to future technological changes; limited visibility with regard to the timing and nature of customer orders; delay in revenue recognition due to longer sales cycles for complex systems involving customers’ acceptance; fluctuating exchange rates; concentration of sales; timely release and market acceptance of our new products and other upcoming products; our ability to successfully expand international operations and to conduct business internationally; and the retention of key technical and management personnel. Assumptions relating to the foregoing involve judgments and risks, all of which are difficult or impossible to predict and many of which are beyond our control. Other risk factors that may affect our future performance and operations are detailed in our Annual Report, on Form 20-F, and our other filings with the U.S. Securities and Exchange Commission and the Canadian securities commissions. We believe that the expectations reflected in the forward-looking statements are reasonable based on information currently available to us, but we cannot assure you that the expectations will prove to have been correct. Accordingly, you should not place undue reliance on these forward-looking statements. These statements speak only as of the date of this document. Unless required by law or applicable regulations, we undertake no obligation to revise or update any of them to reflect events or circumstances that occur after the date of this document. This discussion and analysis should be read in conjunction with the consolidated financial statements.
*NON-IFRS MEASURES
EXFO provides non-IFRS measures (non-IFRS sales, gross margin before depreciation and amortization and adjusted EBITDA) as supplemental information regarding its operational performance. Non-IFRS sales represent total sales less acquisition-related deferred revenue fair value adjustment. Gross margin before depreciation and amortization represents sales, less cost of sales, excluding depreciation and amortization. Adjusted EBITDA represent net earnings (loss) attributable to the parent interest before interest, income taxes, depreciation and amortization, stock-based compensation costs, change in fair value of cash contingent consideration, acquisition-related deferred revenue fair value adjustment, share in net loss of an associate, gain on the deemed disposal of the investment in an associate, and foreign exchange gain or loss.
These non-IFRS measures eliminate the effect on IFRS results of non-cash and/or non-operating statement of earnings elements, as well as elements subject to significant volatility such as foreign exchange gain or loss. EXFO uses these measures for evaluating historical and prospective financial performance, as well as its performance relative to competitors. These non-IFRS measures are also the financial measures used by financial analysts to evaluate and compare EXFO’s performance against competitors and industry players in the company’s sector. Finally, these measures help EXFO plan and forecast future periods as well as make operational and strategic decisions. EXFO believes that providing this information, in addition to the IFRS measures, allows investors to see the company’s results through the eyes of management, and to better understand historical and future financial performance. More importantly, it enables the comparison of EXFO’s performance on a relatively similar basis against other public and private companies in the industry worldwide.
The presentation of this additional information is not prepared in accordance with IFRS. Therefore, the information may not necessarily be comparable to that of other companies and should be considered as a supplement to, not a substitute for, the corresponding measures calculated in accordance with IFRS.
The following table summarizes the reconciliation of non-IFRS sales to IFRS sales, in thousands of US dollars:
Non-IFRS Sales
The following table summarizes the reconciliation of adjusted EBITDA to IFRS net earnings (loss) attributable to the parent interest, in thousands of US dollars:
Adjusted EBITDA
Click here to download the Consolidated Financial Statements (PDF)