EXFO Reports Fourth Quarter and Fiscal 2018 Results
Q4 2018
- Sales reached US$69.2 million
- IFRS net loss totaled US$4.0 million
- Adjusted EBITDA amounted to US$6.1 million
- Announced reorganization plan with US$10.5 million in annualized cost savings
Fiscal 2018
- Sales increased 10.8% to US$269.5 million
- IFRS net loss attributable to the parent interest1 totaled US$11.9 million
- Adjusted EBITDA amounted to US$17.2 million
QUEBEC CITY, CANADA, October 11, 2018 — EXFO Inc. (NASDAQ: EXFO) (TSX: EXF), the communications industry’s test, monitoring and analytics experts, announced today financial results for the fourth quarter and fiscal year ended August 31, 2018.
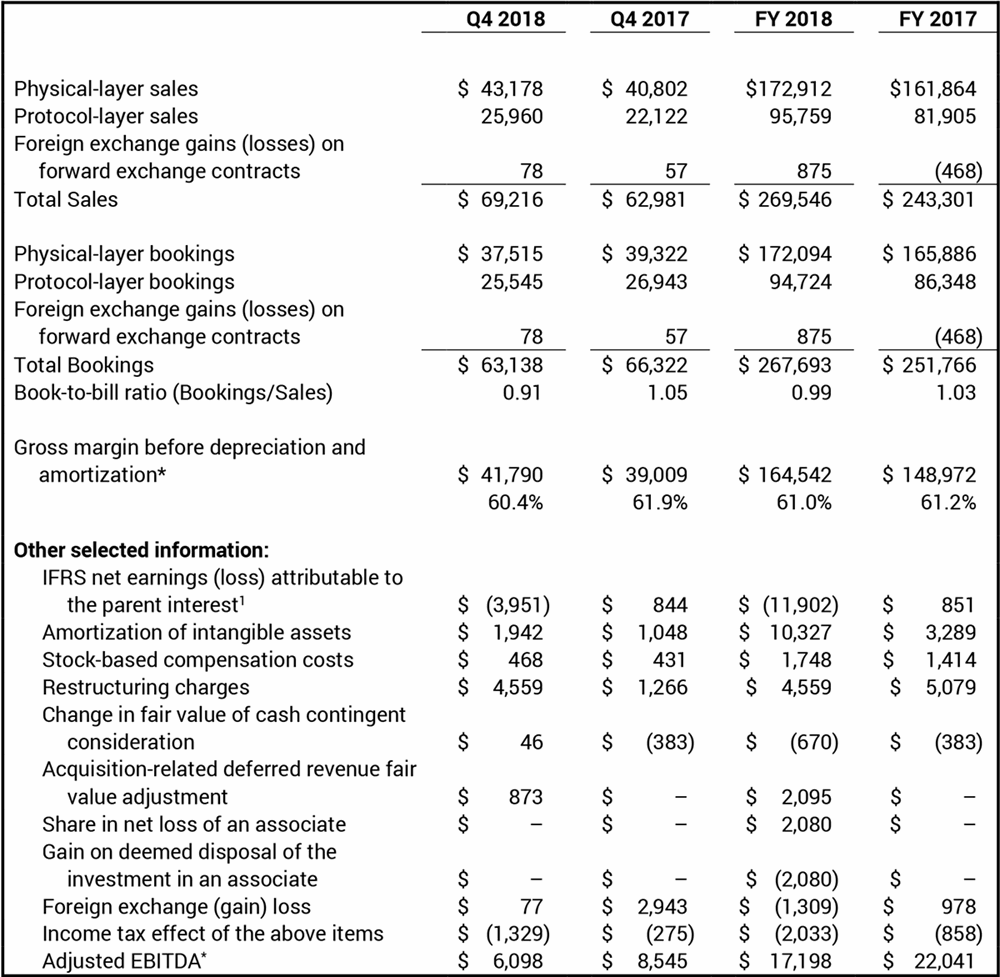
Sales in the fourth quarter of fiscal 2018 reached US$69.2 million compared to US$63.0 million in the fourth quarter of 2017. Annual sales improved 10.8% to US$269.5 million in fiscal 2018 from US$243.3 million in 2017.
Bookings totaled US$63.1 million for a book-to-bill ratio of 0.91 in the fourth quarter of fiscal 2018 compared to US$66.3 million in the fourth quarter of 2017. Overall for fiscal 2018, bookings increased 6.3% to US$267.7 million for a book-to-bill ratio of 0.99 from US$251.8 million in 2017.
Gross margin before depreciation and amortization* attained 60.4% of sales in the fourth quarter of fiscal 2018 compared 61.9% in the fourth quarter of 2017. Gross margin before depreciation and amortization included restructuring charges of 0.7% of sales in the fourth quarter of 2018 and 0.2% in the fourth quarter of 2017. In fiscal 2018, gross margin before depreciation and amortization reached 61.0% of sales compared to 61.2% in 2017. Gross margin before depreciation and amortization included restructuring charges of 0.2% of sales in 2018 and 0.7% in 2017.
In the fourth quarter of fiscal 2018, IFRS net loss amounted to US$4.0 million, or US$0.07 per share, compared to net earnings of US$0.8 million, or US$0.02 per share, in the fourth quarter of 2017. Net loss in the fourth quarter of 2018 included net expenses totaling US$6.6 million: US$1.7 million in after-tax amortization of intangible assets, US$0.5 million in stock-based compensation costs, US$3.4 million in after-tax restructuring changes, US$0.9 million for the deferred revenue fair-value adjustment related to the Astellia acquisition, and a foreign exchange loss of US$0.1 million.
In fiscal 2018, IFRS net loss attributable to the parent interest1 totaled US$11.9 million, or US$0.22 per share, compared to net earnings of US$0.9 million, or US$0.02 per share, in 2017. Net loss in 2018 included net expenses totaling US$17.1 million: US$9.4 million in after-tax amortization of intangible assets, US$1.7 million in stock-based compensation costs, US$3.4 million in after-tax restructuring charges, US$2.1 million for the deferred revenue fair-value adjustment related to the Astellia acquisition, US$0.7 million for the positive change in the fair value of the cash contingent consideration related to the Ontology acquisition, US$2.5 million in after-tax acquisition-related costs, and a foreign exchange gain of US$1.3 million.
Adjusted EBITDA* amounted to US$6.1 million, or 8.8% of sales, in the fourth quarter of fiscal 2018 compared US$8.5 million, or 13.6% of sales, in the fourth quarter of 2017. In fiscal 2018, adjusted EBITDA totaled US$17.2 million, or 6.4% of sales, compared to US$22.0 million, or 9.1% of sales, in 2017.
On August 21, 2018, EXFO announced a reorganization plan to fast-track the integration of newly acquired monitoring and analytics solutions, while reducing the company’s overall cost structure. Once completed in the second half of fiscal 2019, the reorganization is expected to deliver annualized cost savings of US$10.5 million.
EXFO closed two acquisitions in fiscal 2018: Astellia, a leading provider of mobile network and subscriber intelligence, and Yenista Optics, a supplier of advanced optical test equipment for the R&D and manufacturing markets. Astellia generated revenue of US$16.4 million during seven months under EXFO in 2018, while Yenista’s revenue contribution was not material. Astellia's sales were reduced by US$2.1 million to account for acquisition-related fair value adjustment of deferred revenue.
“During fiscal 2018, we made significant progress to strategically transform EXFO into a supplier of software-intensive, end-to-end solutions and analytics for fiber, mobile and virtualized networks,” said Philippe Morin, EXFO’s Chief Executive Officer. “While communications service providers are undergoing fundamental changes to their business models and network architectures with upcoming 5G and IoT deployments, EXFO has positioned itself as a supplier of choice delivering superior network performance, service reliability and subscriber insights through the acquisitions of Astellia and Ontology.”
“Although these transformations are mostly unfolding according to plan, I am disappointed with our financial results in 2018 due to deal delays and the current market environment,” Mr. Morin added. “Nonetheless, we have planned significant improvements for 2019 with an increased focus on execution.”
1Represents net loss excluding share of the net loss attributable to Astellia’s minority shareholders.
Selected Financial Information
(In thousands of US dollars)
Operating Expenses
Selling and administrative expenses totaled US$24.7 million, or 35.7% of sales, in the fourth quarter of fiscal 2018 compared to US$20.8 million, or 33.1% of sales, in the fourth quarter of 2017. In fiscal 2018, selling and administrative expenses amounted to US$98.8 million, or 36.7% of sales, compared to US$86.3 million, or 35.5% of sales, in 2017.
Net R&D expenses amounted to US$16.7 million, or 24.1% of sales, in the fourth quarter of fiscal 2018 compared to US$11.3 million, or 17.8% of sales, in the fourth quarter of 2017. In fiscal 2018, net R&D expenses totaled US$57.2 million, or 21.2% of sales, compared to US$47.2 million, or 19.4% of sales, in 2017.
Fiscal 2018 Highlights
- Sales. Total sales increased 10.8% to US$269.5 million in fiscal 2018 mainly due to revenue contributions from the Astellia and Yenista acquisitions, market-share gains in Physical-layer testing and the positive currency impact. Sales of Physical-layer solutions (optical and copper access) increased 6.8% year-over-year, while sales of Protocol-layer solutions (transport, datacom, service assurance, analytics and wireless products) improved 16.9%.
Annual sales in Europe, Middle East and Africa (EMEA) and Asia-Pacific regions increased 36.4% and 6.5%, respectively, while sales in the Americas remained relatively flat year-over-year.
EXFO’s largest customer accounted for 9.1% of sales in fiscal 2018, while the company’s top-three customers represented 15.9%. In comparison, EXFO’s largest customer accounted for 10.1% of sales in 2017, while the company’s top-three customers represented 18.4%.
- Profitability. IFRS net loss attributable to the parent interest totaled US$11.9 million in fiscal 2018 compared to net earnings attributable to the parent interest of US$0.9 million in 2017. Adjusted EBITDA amounted to US$17.2 million in 2018 compared to US$22.0 million in 2017. EXFO also generated US$14.4 million in cash flows from operating activities in 2018 compared to US$12.9 million in 2017.
- Innovation. EXFO launched seven major solutions in fiscal 2018. New product introductions included a compact 400G test solution for network equipment manufacturers, carrier labs and data centers. The company also introduced SkyRan, a remote access monitoring solution for fiber-based fronthaul networks. Developed in collaboration with tier-1 mobile network operators, SkyRAN provides real-time, on-demand testing and 24/7 monitoring of optical networks and radio frequency spectrum. Other key product introductions included EX1, a multipurpose test solution for validating bandwidth speeds up to full line rate Gigabit Ethernet and for monitoring quality of experience at customer premises; an optical spectrum analyzer delivering in-service optical signal-to-noise ratio (OSNR) measurements for high-speed networks; and an automated network troubleshooting solution that links performance measurements to network topology to deliver service degradation diagnosis.
Business Outlook
EXFO forecasts IFRS sales between US$66.0 million and US$71.0 million for the first quarter of fiscal 2019; the company anticipates that IFRS sales will be reduced by US$0.9 million to account for the acquisition-related fair value adjustment of deferred revenue.
IFRS net loss is expected to range between US$0.20 and US$0.16 per share. IFRS net loss includes a total of US$0.13 per share in after-tax amortization of intangible assets, after-tax restructuring charges, stock-based compensation costs, and acquisition-related fair value adjustment of deferred revenue.
This guidance, which is a forward-looking statement, was established by management based on existing backlog as of the date of this news release, seasonality, expected bookings for the remaining of the quarter as well as exchange rates as of the date of this news release.
Conference Call and Webcast
EXFO will host a conference call today at 5 p.m. (Eastern time) to review fourth quarter and year-end financial results for fiscal 2018. To listen to the conference call and participate in the question period via telephone, dial 1-323-794-2093. Please take note the following conference ID number will be required: 3521447. EXFO’s Executive Chairman Germain Lamonde, CEO Philippe Morin, and Pierre Plamondon, CPA, Vice-President of Finance and Chief Financial Officer, will participate in the call. An audio replay of the conference call will be available two hours after the event until 8:15 p.m. on October 18, 2018. The replay number is 1-719-457-0820 and the conference ID number is 3521447. The audio Webcast and replay of the conference call will also be available on EXFO’s Website at www.EXFO.com, under the Investors section.
About EXFO
EXFO (NASDAQ: EXFO) (TSX: EXF) develops smarter test, monitoring and analytics solutions for fixed and mobile network operators, webscale companies and equipment manufacturers in the global communications industry. Our customers count on us to deliver superior network performance, service reliability and subscriber insights. They count on our unique blend of equipment, software and services to accelerate digital transformations related to fiber, 4G/LTE and 5G deployments. They count on our expertise with automation, real-time troubleshooting and big data analytics, which are critical to their business performance. We’ve spent over 30 years earning this trust, and today more than 2,000 EXFO employees in over 25 countries work side by side with our customers in the lab, field, data center and beyond. For more information, visit EXFO.com and follow us on the EXFO Blog.
Forward-Looking Statements
This news release contains forward-looking statements within the meaning of the U.S. Private Securities Litigation Reform Act of 1995, and we intend that such forward-looking statements be subject to the safe harbors created thereby. Forward-looking statements are statements other than historical information or statements of current condition. Words such as may, expect, believe, plan, anticipate, intend, could, estimate, continue, or similar expressions or the negative of such expressions are intended to identify forward-looking statements. In addition, any statements that refer to expectations, projections or other characterizations of future events and circumstances are considered forward-looking statements. They are not guarantees of future performance and involve risks and uncertainties. Actual results may differ materially from those in forward-looking statements due to various factors including, but not limited to, macroeconomic uncertainty, including trade wars; our ability to successfully integrate businesses that we acquire; capital spending and network deployment levels in the telecommunications industry (including our ability to quickly adapt cost structures to anticipated levels of business and our ability to manage inventory levels with market demand); future economic, competitive, financial and market conditions; consolidation in the global telecommunications test, service assurance and analytics solutions markets and increased competition among vendors; capacity to adapt our future product offering to future technological changes; limited visibility with regard to the timing and nature of customer orders; delay in revenue recognition due to longer sales cycles for complex systems involving customers’ acceptance; fluctuating exchange rates; concentration of sales; timely release and market acceptance of our new products and other upcoming products; our ability to successfully expand international operations and to conduct business internationally; and the retention of key technical and management personnel. Assumptions relating to the foregoing involve judgments and risks, all of which are difficult or impossible to predict and many of which are beyond our control. Other risk factors that may affect our future performance and operations are detailed in our Annual Report, on Form 20-F, and our other filings with the U.S. Securities and Exchange Commission and the Canadian securities commissions. We believe that the expectations reflected in the forward-looking statements are reasonable based on information currently available to us, but we cannot assure you that the expectations will prove to have been correct. Accordingly, you should not place undue reliance on these forward-looking statements. These statements speak only as of the date of this document. Unless required by law or applicable regulations, we undertake no obligation to revise or update any of them to reflect events or circumstances that occur after the date of this document.
*Non-IFRS Measures
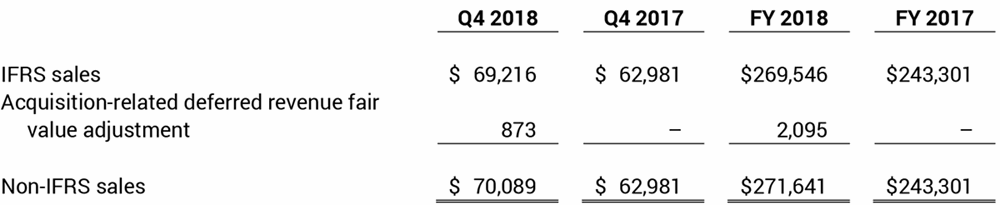
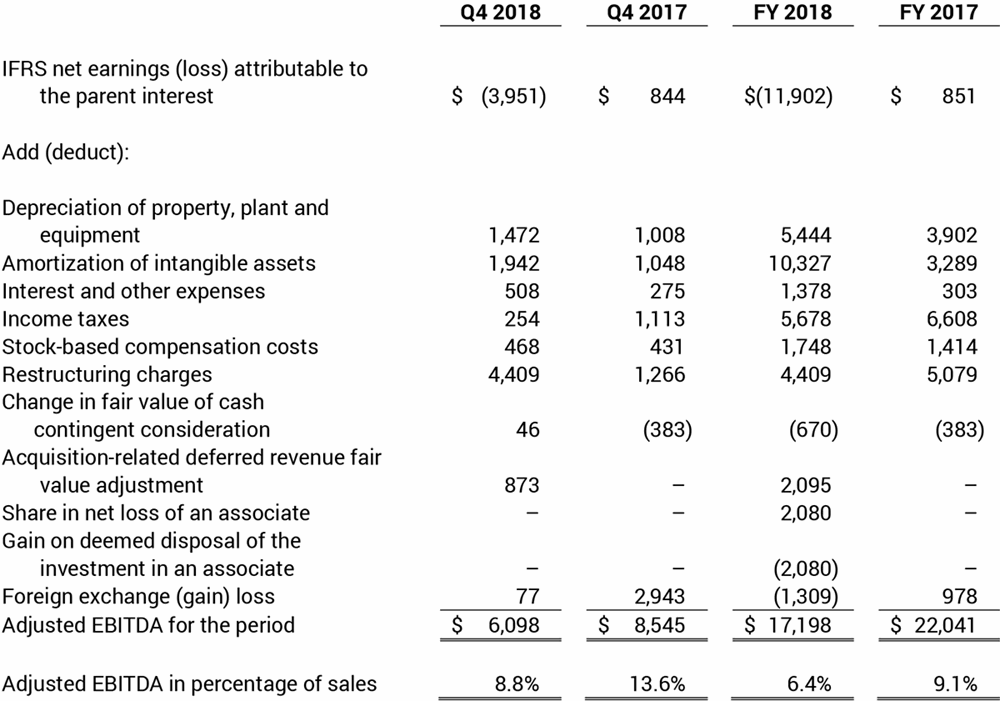
EXFO provides non-IFRS measures (non-IFRS sales, gross margin before depreciation and amortization and adjusted EBITDA) as supplemental information regarding its operational performance. Non-IFRS sales represent total sales plus acquisition-related deferred revenue fair value adjustment. Gross margin before depreciation and amortization represents sales, less cost of sales, excluding depreciation and amortization. Adjusted EBITDA represent net earnings (loss) attributable to the parent interest before interest, income taxes, depreciation and amortization, stock-based compensation costs, restructuring charges, acquisition-related deferred revenue fair value adjustment, change in fair value of cash contingent consideration, share in net loss of an associate, gain on the deemed disposal of the investment in an associate, and foreign exchange gain or loss.
These non-IFRS measures eliminate the effect on the company’s IFRS results of non-cash and/or non-operating statement of earnings elements, as well as elements subject to significant volatility such as foreign exchange gain or loss. EXFO uses these measures for evaluating its historical and prospective financial performance, as well as its performance relative to competitors. These non-IFRS measures are also used by financial analysts to evaluate and compare EXFO’s performance against that of competitors and industry players in the sector.
Finally, these measures help the company plan and forecast future periods as well as make operational and strategic decisions. EXFO believes that providing this information to investors, in addition to the IFRS measures, allows them to see the company’s results through the eyes of management, and to better understand historical and future financial performance. More importantly, it enables the comparison of EXFO’s performance on a relatively similar basis against that of other public and private companies in the industry worldwide.
The presentation of this additional information is not prepared in accordance with IFRS. Therefore, the information may not necessarily be comparable to that of other companies and should be considered as a supplement to, not a substitute for, the corresponding measures calculated in accordance with IFRS.
The following table summarizes the reconciliation of non-IFRS sales to IFRS sales, in thousands of US dollars:
The following table summarizes the reconciliation of adjusted EBITDA to IFRS net earnings (loss) attributable to the parent interest, in thousands of US dollars:
Adjusted EBITDA
For more information
Vance Oliver
Director, Investor Relations
(418) 683-0913, Ext. 23733
vance.oliver@exfo.com