EXFO reports third quarter results for fiscal 2018
- Sales increase 23.4% to US$72.2 million, including US$8.6 million from Astellia
- Bookings improve 14.8% to US$73.1 million, including US$7.6 million from Astellia
- Cash flows from operations total US$4.7 million
QUEBEC CITY, CANADA, July 10, 2018 — EXFO Inc. (NASDAQ: EXFO, TSX: EXF), the communications industry’s test, monitoring and analytics experts, reported today financial results for the third quarter ended May 31, 2018.
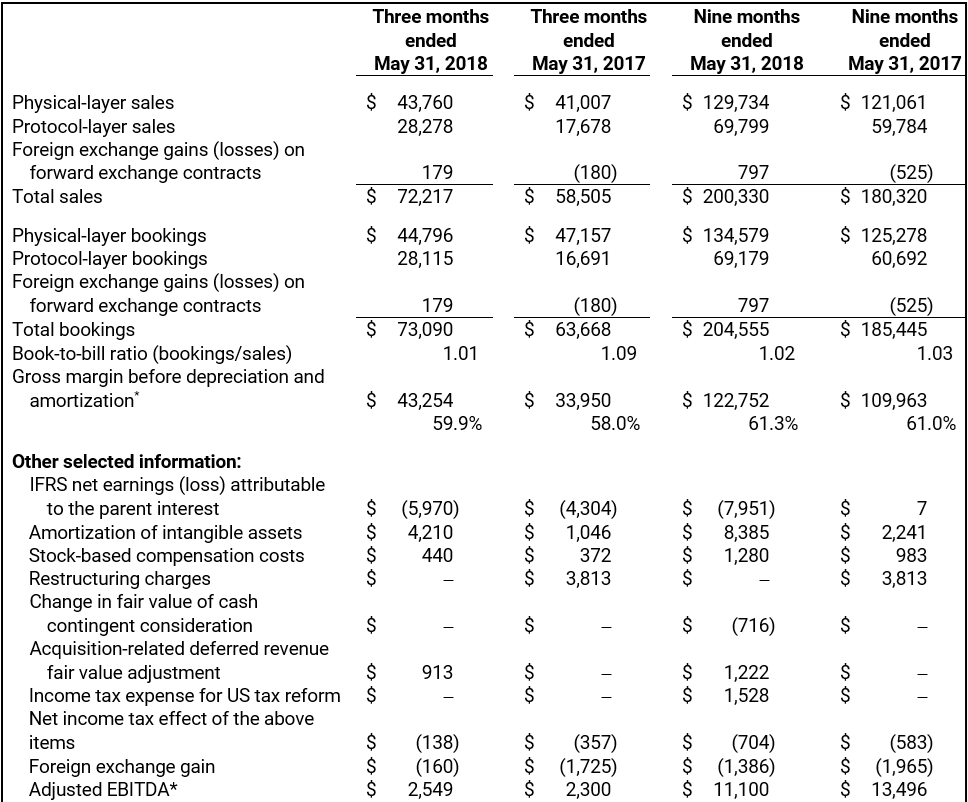
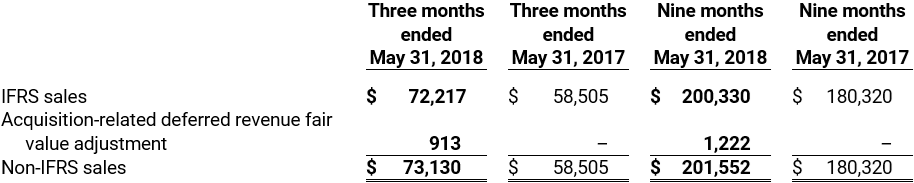
IFRS sales, which included a US$8.6 million contribution from recently acquired Astellia, increased 23.4% to US$72.2 million in the third quarter of fiscal 2018 from US$58.5 million in the third quarter of 2017. Astellia’s sales were reduced by US$0.9 million to account for acquisition-related fair value adjustment of deferred revenue.
Bookings, which included a US$7.6 million contribution from Astellia, improved 14.8% year-over-year to US$73.1 million in the third quarter of fiscal 2018 from US$63.7 million in the same period of 2017. The company’s book-to-bill ratio was 1.01 in the third quarter of 2018.
Gross margin before depreciation and amortization* amounted to 59.9% of sales in the third quarter of fiscal 2018 compared to 58.0% in the third quarter of 2017.
IFRS net loss in the third quarter of fiscal 2018 totaled US$6.0 million, or US$0.11 per share, compared to US$4.3 million, or US$0.08 per share, in the third quarter of 2017. IFRS net loss in the third quarter of 2018 included US$4.1 million in after-tax amortization of intangible assets, US$0.4 million in stock-based compensation costs, US$0.9 million for acquisition-related fair value adjustment of deferred revenue and a foreign exchange gain of US$0.2 million.
Adjusted EBITDA* totaled US$2.5 million, or 3.5% of sales, in the third quarter of fiscal 2018 compared to US$2.3 million, or 3.9% of sales, in the third quarter of 2017.
“I am pleased our organic business and newly acquired Astellia delivered healthy growth in the third quarter and after nine months into fiscal 2018,” said Philippe Morin, EXFO’s Chief Executive Officer. “This solid execution across the combined organization demonstrates that EXFO is on the right path to profitable growth. Looking ahead, we are strategically transforming our monitoring and analytics business to offer a highly differentiated solution as the communications industry migrates to NFV and 5G architectures.”
Selected Financial Information
(In thousands of US dollars)
Operating Expenses
Selling and administrative expenses totaled US$26.0 million, or 35.9% of sales in the third quarter of fiscal 2018 compared to US$22.6 million, or 38.6% of sales, in the third quarter of 2017.
Net R&D expenses totaled US$16.1 million, or 22.3% of sales, in the third quarter of fiscal 2018 compared to US$13.3 million, or 22.7% of sales, in the same period last year.
Third Quarter Highlights
- Sales. IFRS sales increased 23.4% year-over-year to US$72.2 million due to a strong performance from the Protocol-layer product line, revenue contributions from the Astellia and Yenista Optics acquisitions, and the positive impact of the decrease in the average value of the US dollar versus other currencies. Physical-layer sales accounted for 61% of revenue in the third quarter of 2018, while Protocol-layer sales totaled 39%. Revenue breakdown among the three main selling regions amounted to 49% in the Americas, 35% in Europe, Middle East and Africa (EMEA) and 16% in Asia-Pacific. EXFO’s top customer accounted for 5.7% of sales, while the top three represented 15.2%.
- Profitability. IFRS net loss totaled US$6.0 million in the third quarter of 2018, while adjusted EBITDA amounted to US$2.5 million. The company also generated US$4.7 million in cash flows from operations in the third quarter.
- Innovation. EXFO held its inaugural Innovation Summit in early May with a focus on artificial intelligence and machine learning. More than 100 team members from four continents participated in the three-day event which featured a hackathon and presentations from distinguished speakers. EXFO launched two products during the third quarter, including an automated network troubleshooting solution that links performance measurements to network topology in order to deliver service degradation diagnosis in record time. The company also released the CTP10 Component Test Platform, with related modules, for measuring insertion loss and return loss on a wide range of passive optical components.
Business Outlook
EXFO forecasts IFRS sales between US$68.0 million and US$73.0 million for the fourth quarter of fiscal 2018; the company anticipates that IFRS sales will be reduced by US$0.9 million to account for the acquisition-related fair value adjustment of deferred revenue.
IFRS net loss is expected to range between US$0.05 and US$0.01 per share. IFRS net loss includes US$0.10 per share in after-tax amortization of intangible assets, stock-based compensation costs and acquisition-related fair value adjustment of deferred revenue.
This guidance, which is a forward-looking statement, was established by management based on existing backlog as of the date of this news release, seasonality, expected bookings for the remaining of the quarter, Astellia’s preliminary purchase price allocation (PPA) as well as exchange rates as of the date of this news release.
Conference Call and Webcast
EXFO will host a conference call today at 5 p.m. (Eastern time) to review third quarter results for fiscal 2018. To listen to the conference call and participate in the question period via telephone, dial 1-323-994-2093. Please take note the following participant passcode will be required: 7503033. Germain Lamonde, founder and Executive Chairman, Philippe Morin, Chief Executive Officer, and Pierre Plamondon, Vice-President of Finance and Chief Financial Officer, will participate in the call. An audio replay of the conference call will be available two hours after the event until 8:00 p.m. on July 17, 2018. The replay number is 1-719-457-0820 and the required participant passcode is 7503033. The audio Webcast and replay of the conference call will also be available on EXFO’s Website at www.EXFO.com, under the Investors section.
About EXFO
EXFO (NASDAQ: EXFO) (TSX: EXF) develops smarter test, monitoring and analytics solutions for fixed and mobile network operators, webscale companies and equipment manufacturers in the global communications industry. Our customers count on us to deliver superior network performance, service reliability and subscriber insights. They count on our unique blend of equipment, software and services to accelerate digital transformations related to fiber, 4G/LTE and 5G deployments. They count on our expertise with automation, real-time troubleshooting and big data analytics, which are critical to their business performance. We’ve spent over 30 years earning this trust, and today more than 2,000 EXFO employees in over 25 countries work side by side with our customers in the lab, field, data center and beyond. For more information, visit EXFO.com and follow us on the EXFO Blog.
Forward-Looking Statements
This news release contains forward-looking statements within the meaning of the U.S. Private Securities Litigation Reform Act of 1995, and we intend that such forward-looking statements be subject to the safe harbors created thereby. Forward-looking statements are statements other than historical information or statements of current condition. Words such as may, expect, believe, plan, anticipate, intend, could, estimate, continue, or similar expressions or the negative of such expressions are intended to identify forward-looking statements. In addition, any statements that refer to expectations, projections or other characterizations of future events and circumstances are considered forward-looking statements. They are not guarantees of future performance and involve risks and uncertainties. Actual results may differ materially from those in forward-looking statements due to various factors including, but not limited to, macroeconomic uncertainty, including trade wars, as well as capital spending and network deployment levels in the telecommunications industry (including our ability to quickly adapt cost structures to anticipated levels of business and our ability to manage inventory levels with market demand); future economic, competitive, financial and market conditions; consolidation in the global telecommunications test, service assurance and analytics solutions markets and increased competition among vendors; our ability to successfully integrate businesses that we acquire; capacity to adapt our future product offering to future technological changes; limited visibility with regard to the timing and nature of customer orders; delay in revenue recognition due to longer sales cycles for complex systems involving customers’ acceptance; fluctuating exchange rates; concentration of sales; timely release and market acceptance of our new products and other upcoming products; our ability to successfully expand international operations and to conduct business internationally; and the retention of key technical and management personnel. Assumptions relating to the foregoing involve judgments and risks, all of which are difficult or impossible to predict and many of which are beyond our control. Other risk factors that may affect our future performance and operations are detailed in our Annual Report, on Form 20-F, and our other filings with the U.S. Securities and Exchange Commission and the Canadian securities commissions. We believe that the expectations reflected in the forward-looking statements are reasonable based on information currently available to us, but we cannot assure you that the expectations will prove to have been correct. Accordingly, you should not place undue reliance on these forward-looking statements. These statements speak only as of the date of this document. Unless required by law or applicable regulations, we undertake no obligation to revise or update any of them to reflect events or circumstances that occur after the date of this document. This discussion and analysis should be read in conjunction with the consolidated financial statements.
*NON-IFRS MEASURES
EXFO provides non-IFRS measures (non-IFRS sales, gross margin before depreciation and amortization and adjusted EBITDA) as supplemental information regarding its operational performance. Non-IFRS sales represent total sales plus acquisition-related deferred revenue fair value adjustment. Gross margin before depreciation and amortization represents sales, less cost of sales, excluding depreciation and amortization. Adjusted EBITDA represent net earnings (loss) attributable to the parent interest before interest, income taxes, depreciation and amortization, stock-based compensation costs, change in fair value of cash contingent consideration, acquisition-related deferred revenue fair value adjustment, share in net loss of an associate, gain on the deemed disposal of the investment in an associate, and foreign exchange gain or loss.
These non-IFRS measures eliminate the effect on IFRS results of non-cash and/or non-operating statement of earnings elements, as well as elements subject to significant volatility such as foreign exchange gain or loss. EXFO uses these measures for evaluating historical and prospective financial performance, as well as its performance relative to competitors. These non-IFRS measures are also the financial measures used by financial analysts to evaluate and compare EXFO’s performance against competitors and industry players in the company’s sector. Finally, these measures help EXFO plan and forecast future periods as well as make operational and strategic decisions. EXFO believes that providing this information, in addition to the IFRS measures, allows investors to see the company’s results through the eyes of management, and to better understand historical and future financial performance. More importantly, it enables the comparison of EXFO’s performance on a relatively similar basis against other public and private companies in the industry worldwide.
The presentation of this additional information is not prepared in accordance with IFRS. Therefore, the information may not necessarily be comparable to that of other companies and should be considered as a supplement to, not a substitute for, the corresponding measures calculated in accordance with IFRS.
The following table summarizes the reconciliation of non-IFRS sales to IFRS sales, in thousands of US dollars:
Non-IFRS Sales
The following table summarizes the reconciliation of adjusted EBITDA to IFRS net earnings (loss) attributable to the parent interest, in thousands of US dollars:
Adjusted EBITDA
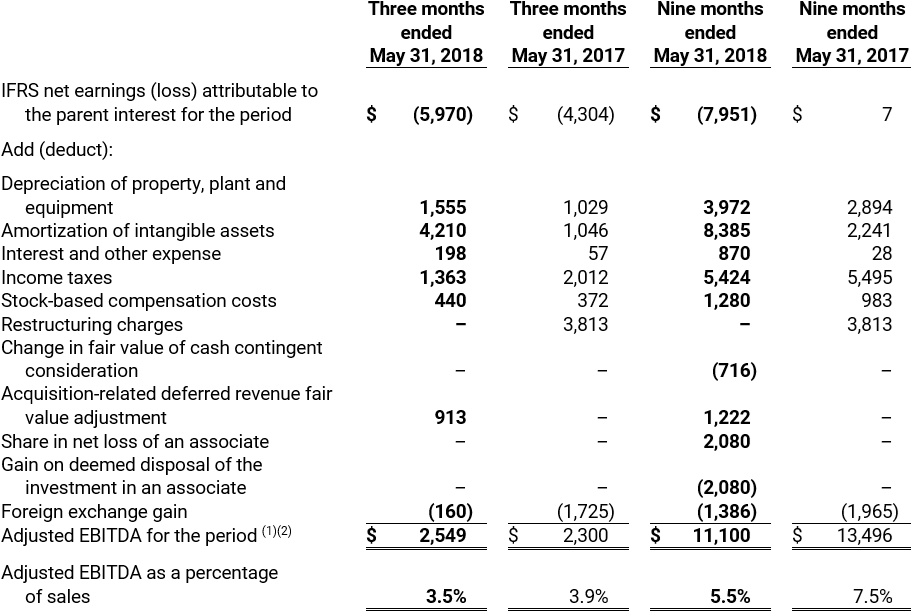
(1) Astellia negatively impacted adjusted EBITDA by $2 million and $3.4 million respectively for the three and nine months ended May 31, 2018 (nil in 2017).
(2) Includes acquisition-related costs of $1 million for the nine months ended May 31, 2018 and $0.1 million and $0.8 million respectively for the three and nine months ended May 31, 2017.
Click here to download the Consolidated Financial Statements (PDF)