Optical Spectrum Analyzers in Next-Gen Networks
Several high-bandwidth networks have recently been upgraded to include reconfigurable optical add/drop multiplexers (ROADMs) to improve efficiency and flexibility. ROADMs allow networks to remotely change the amount of dropped or added wavelengths on the express route in order to optimize bandwidth—for example, by not dropping wavelengths when bandwidth is not required.
At the heart of a ROADM is a wavelength-selectable switch (WSS), which is used to redirect any wavelength to any direction; the WSS operates independent of color, direction and contention. While this does in fact offer network flexibility, scalability and security, it also changes the testing rules.
The function of the receiver is to provide the demodulator with the cleanest electrical signal it can extract from the optical signal it receives. To determine how good a signal traveling through a dense wavelength-division multiplexer (DWDM) system is, an optical spectrum analyzer (OSA) is used to measure the optical signal-to-noise ratio (OSNR) of that signal. The OSA can characterize the ‘head room’ between the peak power and the noise floor at the receiver for each channel; this value provides an indication of the readability of the received signal a parameter of increasing interest as the limits are pushed farther and farther to accommodate long-distance applications.
The OSNR is the ratio between a signal, or meaningful information, and the background noise. OSNR provides indirect information about the bit-error rate (BER), which makes it the most useful parameter available from the measured spectrum, and that is why it is listed as an interface parameter in ITU-T Recommendation G.692 and in ITU-T Recommendation G.959.1.
Conventional OSNR Measurement Methods
The conventional method for determining the OSNR is called interpolation, as defined by the IEC-61280-2-9. It requires that the noise level be measured at the mid-point between two peaks and that a linear interpolation be performed. The noise under the peak can then be estimated, and the OSNR is calculated.

This method makes two assumptions, which were accurate for non-next-gen networks: first, it assumes that this noise is flat across the analysis band; and second, it assumes that the signal between channels does in fact go down to the noise level.
Assumption 1: Flat Noise
A schematic of a ROADM is illustrated below. ROADMs are typically placed at important nodes and since they replace routers, there is no signal regeneration within the ROADM itself. Therefore, an optical line amplifier is used to boost the signal before entering the ROADM. The WSS is then used to select which wavelength goes where at any given time.
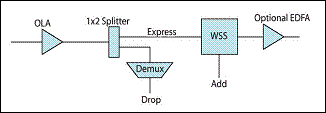
A broadband signal, such as the amplified spontaneous emission noise of any of the amplifiers going through any WSS, gets filtered, and the output is more or less an image of the filters (or cascaded filters after several ROADMs).
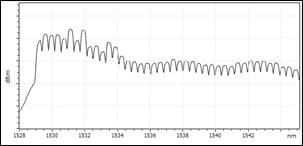
It is clear, in this case, that the assumption that the noise is flat does not hold true. Using the interpolation method will therefore under-estimate the noise level, leading to an erroneous assessment that performance is better than it actually is and creating a false sense of security.
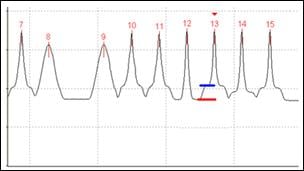
Using Channel 13 in the image below as an example, a traditional OSA using the interpolation method would have measured the noise at the level of the red bar, whereas the true noise is at the blue bar. OSNR is not as high as measured and perceived, so it must be measured where it is significant; i.e., under the peak, referred to as in-band OSNR.
Assumption 2: Reaching Noise Level between Channels
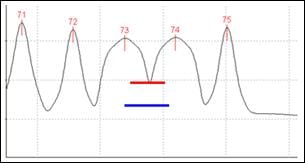
The advent of faster bit rates, such as 40 Gbit/s for example, brings with it a much more complex and broader spectral shape, as shown in the image below:
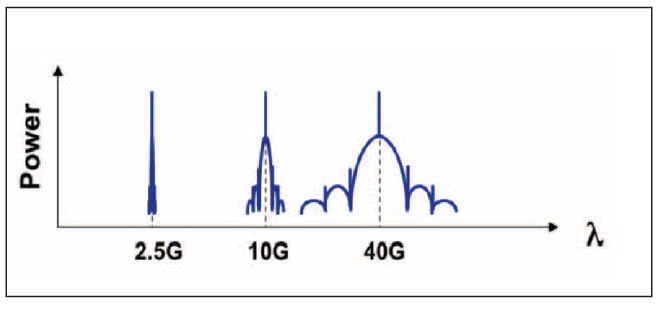
In an effort to have as much bandwidth as possible, since most long-haul and metro networks are already prepared for 50 GHz channel spacing, this spacing needs to be kept when handling faster speeds. This means that optical signals are closely spaced and may overlap, thus hiding the noise baseline between them.
Using the interpolation method will lead to over-estimation of the noise level, which in turn would suggest that the performance is not as good as it really is and that there is a problem on the network.
Using Channels 73 and 74 in the image below as an example, a traditional OSA that makes use of the interpolation method would have measured the noise at the level of the red bar, whereas the true noise is at the blue bar. OSNR in this case is higher than measured and perceived. As mentioned previously, noise must be measured where it is significant; i.e., under the peak, referred to as in-band OSNR.
Dealing with the Mix
A complex next-gen network can very well have both 10 Gbit/s and 40 Gbit/s signals, all going through cascaded ROADMs, therefore applying both above-mentioned situations/assumptions. Here is an example:
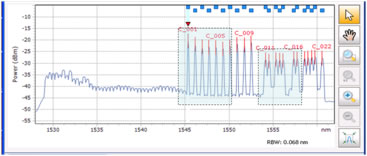
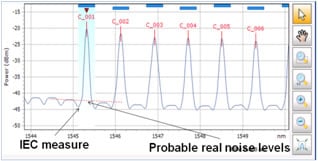
The first highlighted zone, which includes the first 10 channels, is a condition of 10 Gbit/s transmission, where the noise floor is quite visible, but the noise is obviously not fl at (the section before 1545 nm proves this). Highlighted below is the mistake a traditional OSA would make:
|
Channel Number |
Interpolation OSNR |
True OSNR |
Error |
|
1 |
24.09 |
21.27 |
2.82 |
|
2 |
23.28 |
22.57 |
0.71 |
|
3 |
22.84 |
21.93 |
0.91 |
|
4 |
22.80 |
20.65 |
2.15 |
|
5 |
22.41 |
19.90 |
2.51 |
|
6 |
22.00 |
19.34 |
2.66 |
|
7 |
22.48 |
19.28 |
3.20 |
|
8 |
23.08 |
19.79 |
3.29 |
|
9 |
23.14 |
20.40 |
2.74 |
|
10 |
23.92 |
20.49 |
3.43 |
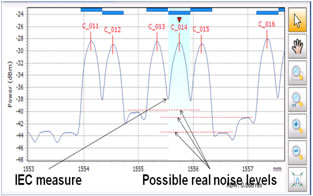
The second highlighted zone, from Channel 11 to Channel 22, reveals the other problem: larger signals hide the noise line (plus the fact that the noise is not flat):
|
Channel Number |
Interpolation OSNR |
True OSNR |
Error |
|
11 |
14.98 |
17.73 |
-2.75 |
|
12 |
14.32 |
16.65 |
-2.33 |
|
13 |
14.44 |
17.93 |
-3.49 |
|
14 |
13.4 |
18.1 |
-4.70 |
|
15 |
15.28 |
19.12 |
-3.84 |
|
16 |
14.63 |
18.1 |
-3.47 |
|
17 |
14.85 |
17.49 |
-2.64 |
|
18 |
14.55 |
18.55 |
-4.00 |
|
19 |
13.4 |
17.63 |
-4.23 |
|
20 |
13.63 |
17.79 |
-4.16 |
|
21 |
15.06 |
18.39 |
-3.33 |
|
22 |
17.69 |
20.35 |
-2.66 |
Therefore, regardless of what type of next-gen network you have or are planning to deploy, if it includes either ROADMs or 40 Gbit/s and faster modulations, any traditional OSA will fail to produce a proper result. This is why next-generation OSAs, based on a technique known as hybrid detection, are required for accurate in-band OSNR measurements.


